Data collected to, processed on Tier0, can be visualized in charts, tables, heat maps and other formats on a dashboard to provide a comprehensive insight.
- Log in to Tier0, and select UNS > Dashboards.
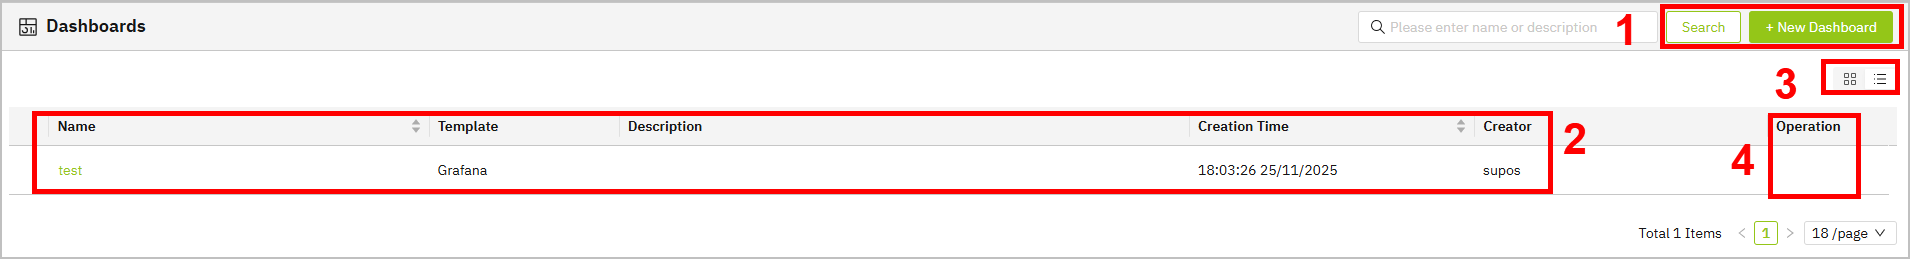
| Index | Item | Description |
|---|
| 1 | Search | Search for existing dashboards. |
| New Dashboard | Add a dashboard. |
| 2 | Dashboard List | Displays dashboard information. Click the name to start editing. |
| 3 | Display | Switch dashboard display between blocks and list. |
| 4 | Operations | Copy / Edit / Delete the dashboard. |
- Click New Dashboard to add a dashboard.
- Click the dashboard name to start editing.
- Click Add Visualization, and then select a data source for the dashboard in the pop-up window.
- The default tmsc is the internal database where the data collected on Namespace is stored.
- Click Configure a new data source at the lower-right corner to configure other data sources. e.g. MQTT.
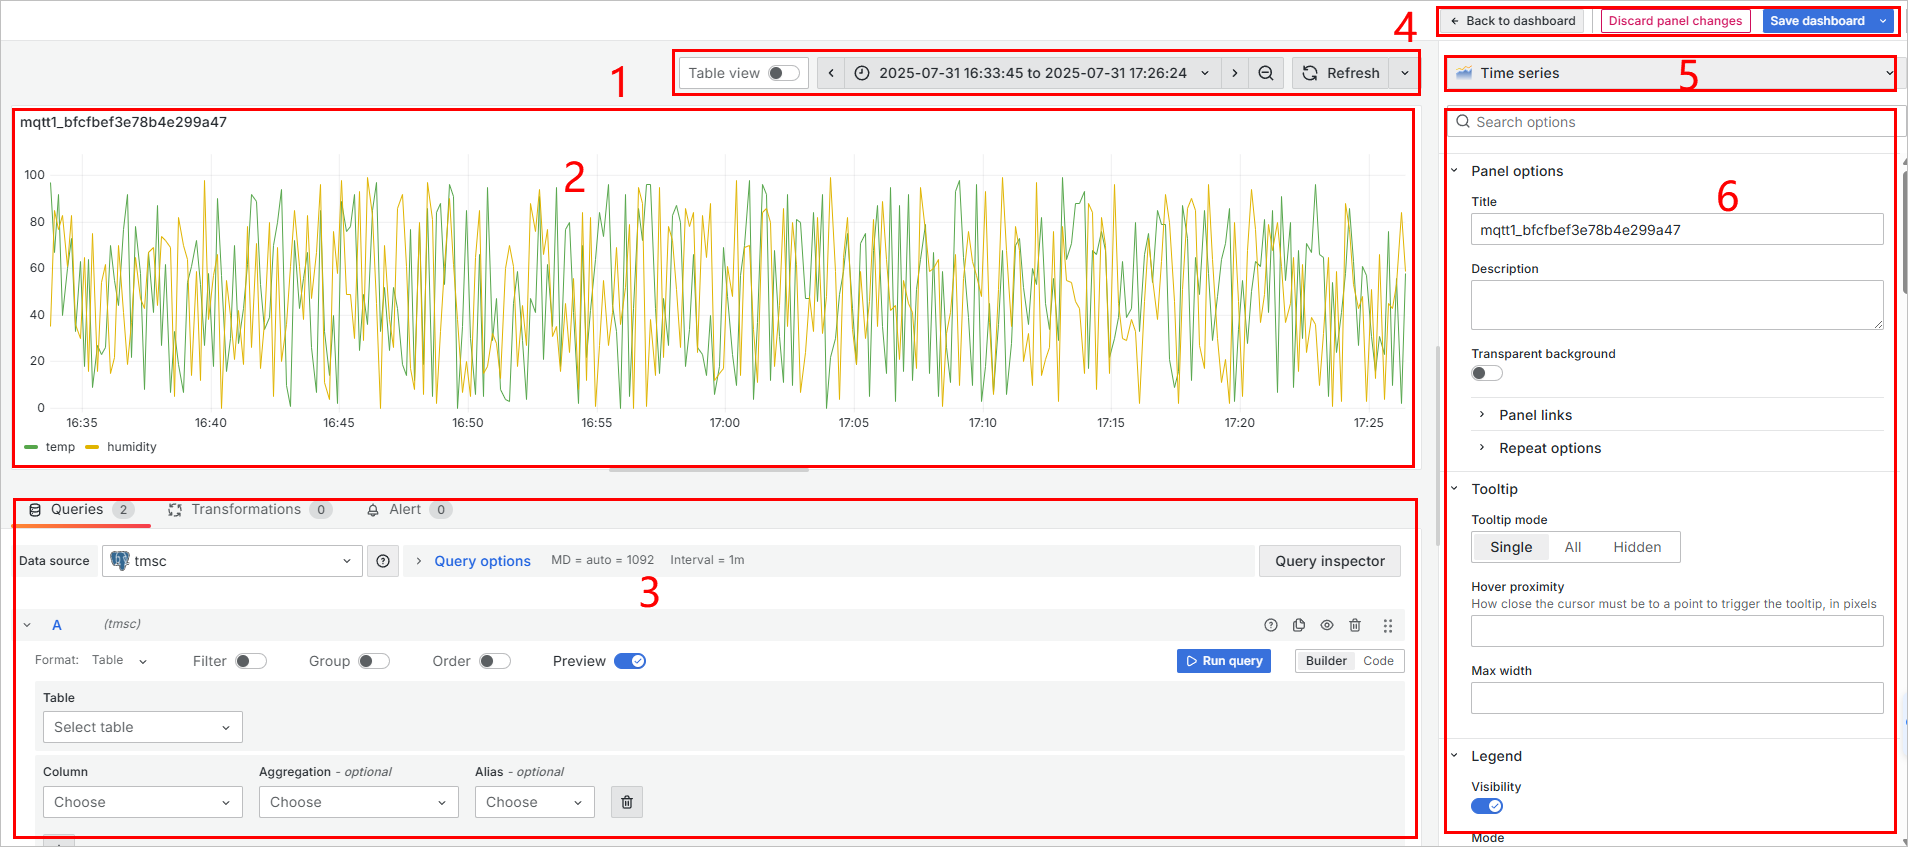
| Index | Item | Description |
|---|
| 1 | Tools | Switch between chart and table views. |
| Time Range | Select the time range where the data is displayed. |
| Refresh | Refresh the element. |
| 2 | Display Area | Display the current data source via the selected element. |
| 3 | Data Source Configuration | Change data source, and you can either select columns from the database or directly use SQL query to handle complex data. |
| 4 | General Operations | Go back to dashboard list/discard the changes on the current panel/save the dashboard. |
| 5 | Element | Select different elements for displaying the data. |
| 6 | Element Configuration | Configurations of the current element. |